Every square foot of your venue costs money. The question is: which entertainment option earns it back fastest? Some attractions generate $350 per square foot annually while others struggle to hit $30. This article compares actual startup costs, revenue data, profit margins, and ROI timelines for karaoke rooms against nine competing options: VR arcades, bowling alleys, arcade games, axe throwing, escape rooms, mini golf, trampoline parks, billiards, and darts. The numbers will help you make informed decisions about your entertainment investment.
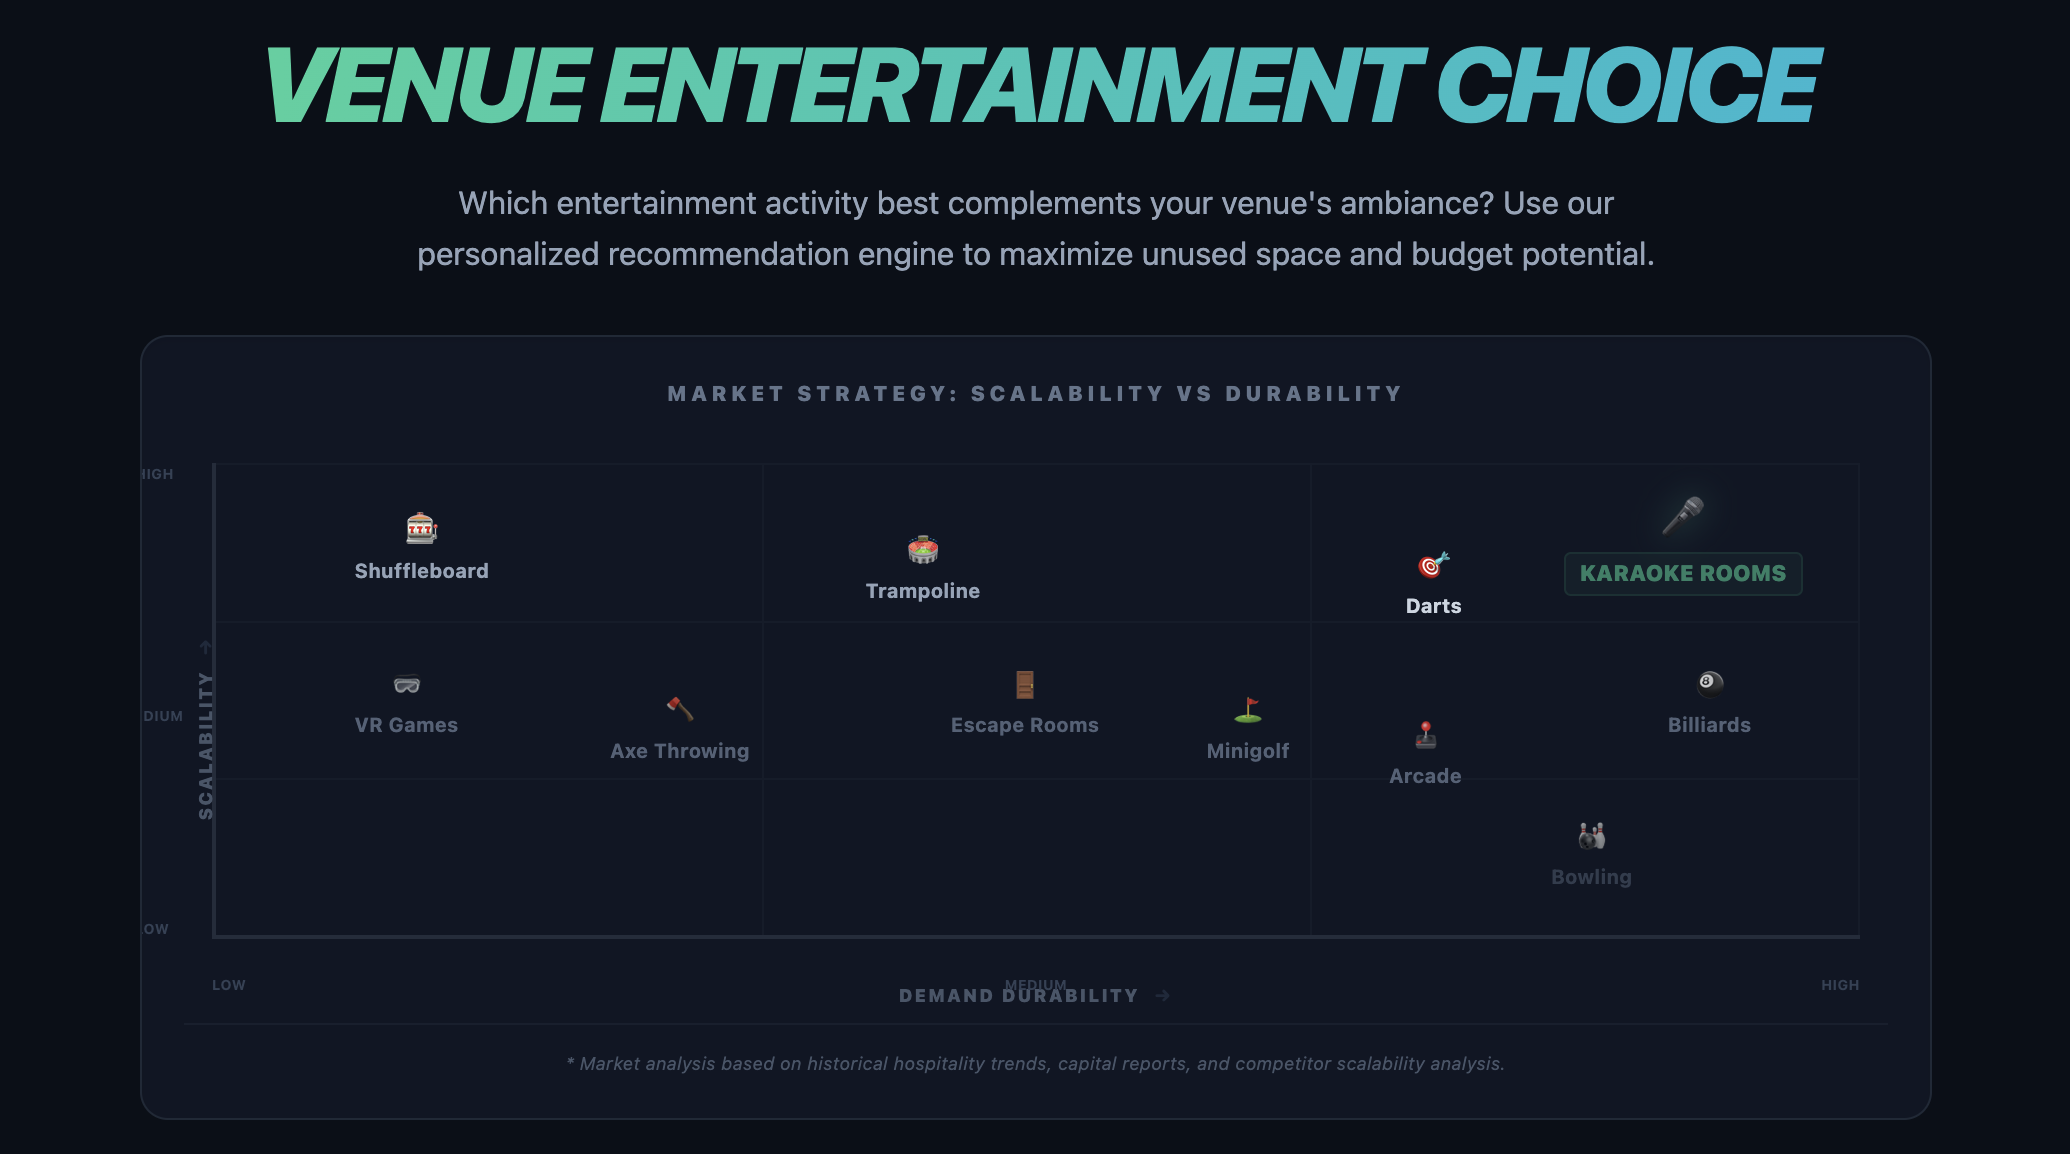
The analysis draws on data used in our new Venue Entertainment Choice calculator, built to help operators model revenue potential with greater clarity. By examining hospitality benchmarks, capital expenditure ranges, and performance patterns across entertainment formats, it becomes easier to see how different concepts compare in terms of revenue density, repeatability, and long-term return.
Table of contents:
- Why operators are rethinking their entertainment offers
- Key metrics that determine revenue uplift
- Why revenue per square foot matters more than you think
- Entertainment revenue breakdown
- Entertainment concepts compared across key metrics
- The financial case for karaoke rooms
- How other entertainment options compare
- Realistic revenue uplift examples
- Making the right entertainment choice for your venue
- Try the calculator: find your optimal entertainment mix
- The bottom line on entertainment ROI
Why operators are rethinking their entertainment offers
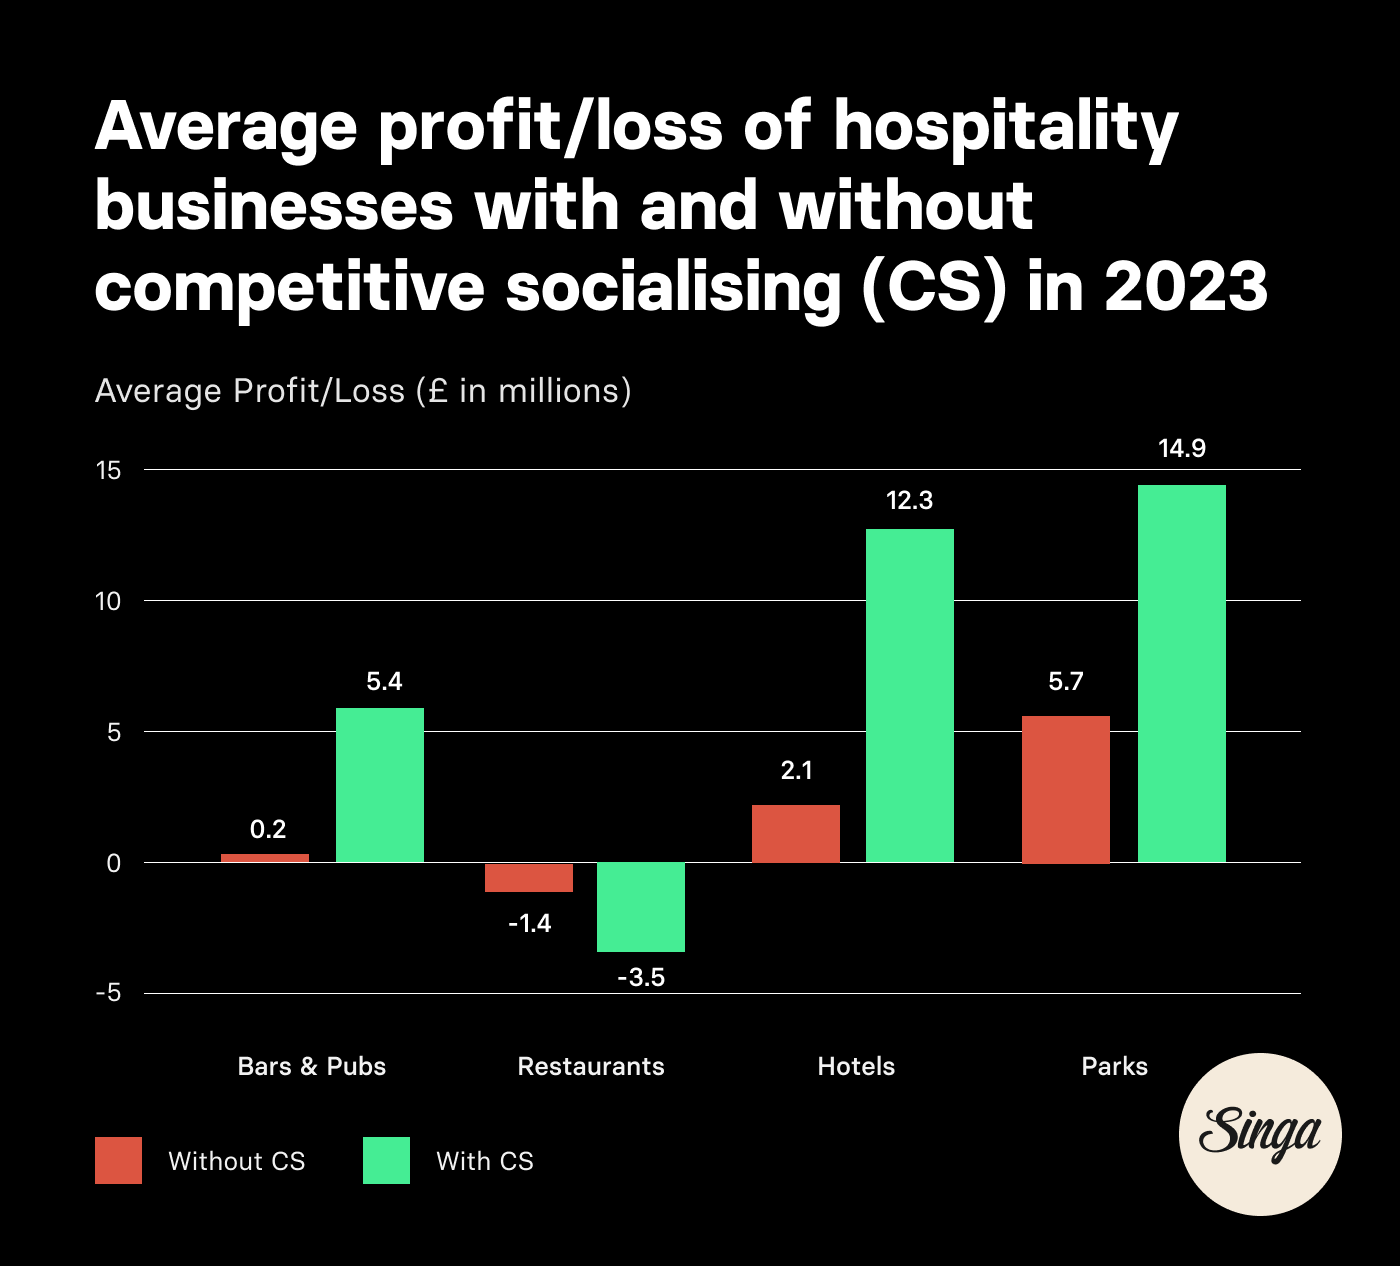
Experiential leisure is transforming how venues compete. Traditional food-and-drink models are giving way to competitive socialising concepts that drive higher spending and repeat visits.
The numbers tell the story: Savills research projects over 800 competitive socialising venues by 2029, representing 40% growth since 2018. The demand is real, with 30% of UK adults now visit these venues regularly and 35% returning weekly. This trend mirrors broader consumer behavior shifts:
U.S. recreation spending continues climbing even as goods consumption fluctuates, confirming customers prioritize experiences.
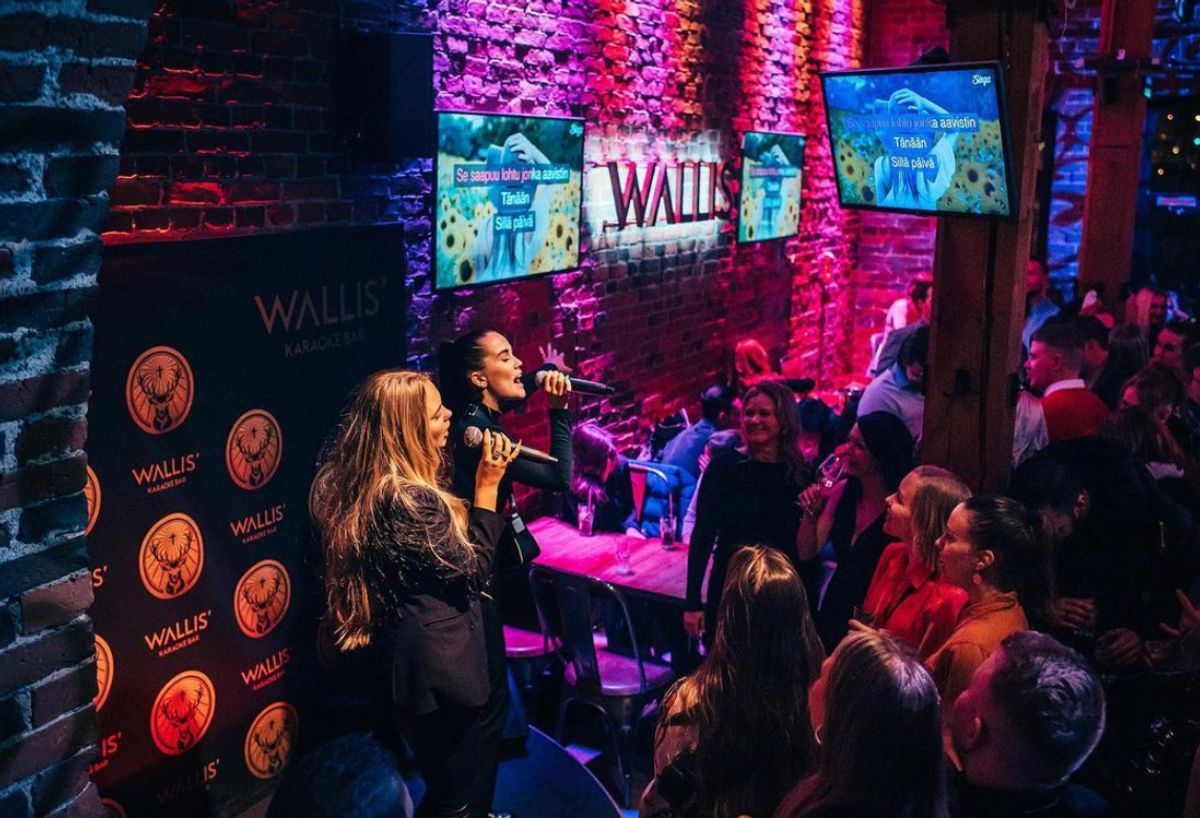
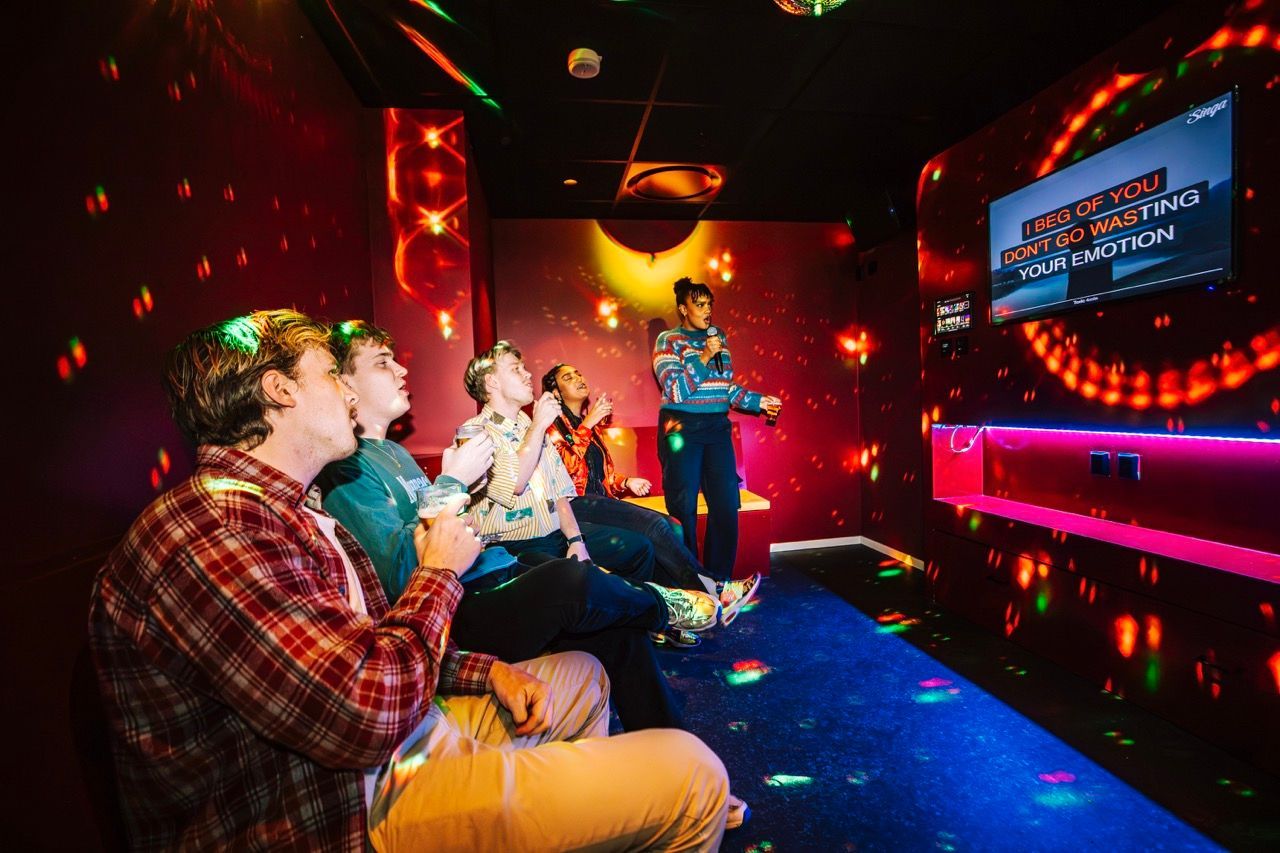
Private karaoke rooms sit at the sweet spot of this transformation. The format naturally delivers what competitive socialising venues need:
- Group entertainment: average sessions accommodate 4-12 people.
- Food and beverage integration: private rooms encourage longer stays and higher F&B spend.
- Low operational complexity: minimal staff needed compared to bowling or trampoline parks.
- Weather independence: year-round consistent demand.
The results prove the concept works. London venues adding karaoke saw customer numbers increase 31% and spending jump 42%. The global karaoke market is expanding at 8.9% CAGR toward $6.8 billion by 2032, with private room formats capturing 55% of demand.
But success requires strategic choices: which competitive socialising format delivers the highest revenue uplift relative to your available space, existing infrastructure, and budget constraints?
Key metrics that determine revenue uplift
When comparing entertainment concepts, operators should focus on seven core revenue drivers:
- Revenue per square foot (or square meter). The ultimate efficiency measure for space-constrained venues.
- Average spend per guest. Both activity fees and ancillary F&B revenue.
- Dwell time. Longer stays create more opportunities for additional purchases.
- Staffing requirements. Labor costs directly impact net margins.
- Equipment and maintenance costs. Ongoing expenses that erode profitability.
- Scalability. How easily can you add more capacity or replicate the model without a linear increase in costs?
- Durability. Is this a passing trend (like the "fidget spinner" of entertainment), or does it have the staying power to remain profitable for a decade?
A concept that drives high guest spend but requires constant staffing may generate lower margins than a self-service model with slightly lower ticket size. Similarly, an attraction with impressive first-year numbers but unclear longevity presents significant risk compared to proven formats with decades of sustained demand.
Why revenue per square foot matters more than you think
When evaluating entertainment options, most operators focus on total revenue potential. However, the real metric that determines profitability is revenue per square foot. A compact entertainment option that generates $300 per square foot annually will outperform a sprawling attraction earning $150 per square foot, assuming similar profit margins.
Space efficiency directly impacts your bottom line through reduced rent, lower utility costs, and the ability to pack multiple revenue streams into your venue.
Entertainment revenue breakdown
Based on 2024-2025 industry data, here's how different entertainment options stack up.
Investment requirements
Upfront investment matters. Lower capital expenditure shortens payback time.
| Entertainment Type | Initial Investment (USD) | Initial Investment (EUR) | Space Required (sq ft) | Space Required (sq m) | Equipment Cost (USD) | Equipment Cost (EUR) |
|---|---|---|---|---|---|---|
| Karaoke Rooms (2 rooms) | $22,000 - $38,500 | €20,000 - €35,000 | 129 - 484 | 12 - 45 | $10,000 - $20,000 | €9,000 - €18,000 |
| Self-Service Karaoke | $5,500 - $16,500 | €5,000 - €15,000 | 100 - 300 | 10 - 30 | $4,400 - $13,200 | €4,000 - €12,000 |
| Bowling (per lane) | $18,000 - $45,000 | €16,500 - €41,000 | 100 - 150 per lane | 9 - 14 per lane | $15,000 - $45,000 per lane | €14,000 - €41,000 |
| Arcade (15-30 machines) | $50,000 - $150,000 | €45,500 - €137,000 | 1,500 - 3,000 | 140 - 280 | $30,000 - $100,000 | €27,000 - €91,000 |
| VR Games (4-6 stations) | $50,000 - $120,000 | €45,500 - €109,000 | 250 - 1,000 | 23 - 93 | $30,000 - $80,000 | €27,000 - €73,000 |
| Axe Throwing (6 lanes) | $50,000 - $250,000 | €45,500 - €228,000 | 2,000 - 4,000 | 186 - 372 | $15,000 - $40,000 | €14,000 - €36,000 |
| Escape Rooms (2 rooms) | $14,000 - $100,000 | €13,000 - €91,000 | 1,000 - 2,000 | 93 - 186 | $7,000 - $50,000 | €6,400 - €45,500 |
| Mini Golf (18 holes) | $300,000 - $800,000 | €273,000 - €728,000 | 5,000 - 20,000 | 465 - 1,858 | $150,000 - $500,000 | €137,000 - €455,000 |
| Trampoline Park | $500,000 - $3,000,000 | €455,000 - €2,730,000 | 25,000 - 40,000 | 2,323 - 3,716 | $100,000 - $500,000 | €91,000 - €455,000 |
| Billiards/Pool (per table) | $1,000 - $5,000 | €900 - €4,500 | 130 - 160 per table | 12 - 15 per table | $800 - $4,000 per table | €700 - €3,600 |
Revenue density: hourly performance comparison
Space efficiency is critical in urban venues. Below is a comparison based on a 100 sq m (1,076 sq ft) allocation showing how much revenue different entertainment options can generate per hour.
| Entertainment Concept | Approx Capacity | Hourly Revenue (USD) | Hourly Revenue (EUR) | Revenue per sq ft per hour (USD) | Revenue per sq m per hour (EUR) |
|---|---|---|---|---|---|
| 4 Karaoke Rooms | 32-40 guests | $440 - $880 | €400 - €800 | $0.41 - $0.82 | €4.00 - €8.00 |
| Self-Service Karaoke | 20-30 guests | $330 - $660 | €300 - €600 | $0.31 - $0.61 | €3.00 - €6.00 |
| Escape Rooms (2 rooms) | 10-16 guests | $176 - $330 | €160 - €300 | $0.16 - $0.31 | €1.60 - €3.00 |
| Bowling (2 lanes) | 8-12 guests | $132 - $264 | €120 - €240 | $0.12 - $0.25 | €1.20 - €2.40 |
| Mini Golf Course | 20-30 guests | $165 - $330 | €150 - €300 | $0.15 - $0.31 | €1.50 - €3.00 |
| Arcade Area | Variable | $110 - $275 | €100 - €250 | $0.10 - $0.26 | €1.00 - €2.50 |
| VR Arena | 12-18 guests | $198 - $440 | €180 - €400 | $0.18 - $0.41 | €1.80 - €4.00 |
| Axe Throwing (2 lanes) | 8-12 guests | $88 - $176 | €80 - €160 | $0.08 - $0.16 | €0.80 - €1.60 |
| Trampoline Zone | 15-25 guests | $165 - $330 | €150 - €300 | $0.15 - $0.31 | €1.50 - €3.00 |
| Billiards (4 tables) | 8-16 guests | $44 - $88 | €40 - €80 | $0.04 - $0.08 | €0.40 - €0.80 |
Karaoke rooms often deliver higher revenue density because:
- Rooms operate continuously during peak hours
- Multiple guests pay simultaneously
- Food and beverage orders are centralized
This makes karaoke particularly attractive for city-center bars and underutilized private rooms.
Annual revenue potential
| Entertainment Type | Annual Revenue (USD) | Annual Revenue (EUR) | Revenue Per Unit (USD) | Revenue Per Unit (EUR) |
|---|---|---|---|---|
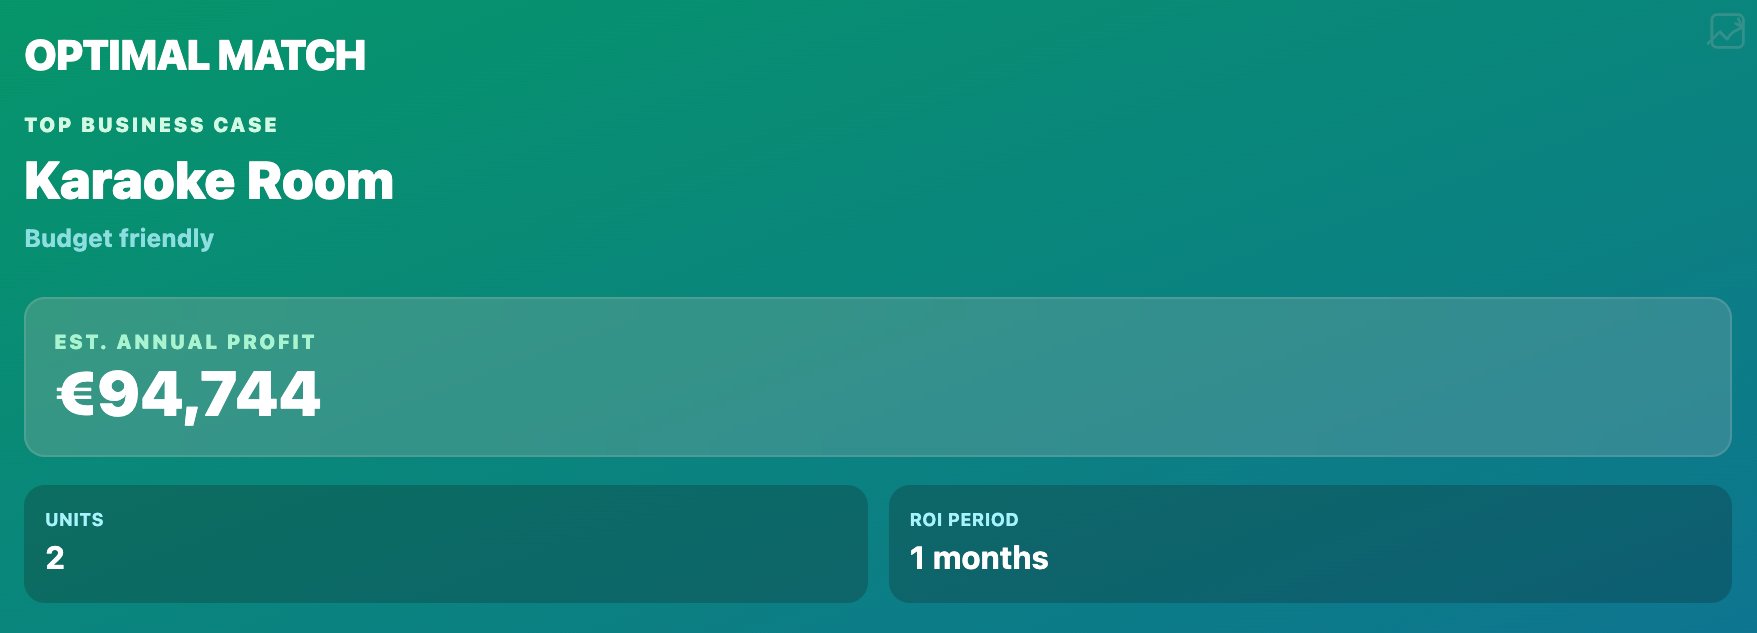
| Karaoke Rooms (2 rooms) | $187,000 - $280,000 | €170,000 - €255,000 | $94,000/room | €85,500/room |
| Self-Service Karaoke | $50,000 - $150,000 | €45,500 - €136,500 | $50,000 - $150,000/setup | €45,500 - €136,500/setup |
| Bowling (12 lanes) | $600,000 - $2,500,000 | €545,000 - €2,275,000 | $36,750/lane | €33,400/lane |
| Arcade (30 machines) | $360,000 - $600,000 | €327,000 - €545,000 | $200-$485/machine/week | €182-€441/machine/week |
| VR Games (small setup) | $62,400 - $660,000 | €56,700 - €600,000 | $5,200-$55,000/month | €4,700-€50,000/month |
| Axe Throwing (6 lanes) | $250,000 - $750,000 | €228,000 - €682,000 | $468,000/10 lanes | €425,000/10 lanes |
| Escape Rooms (2 rooms) | $180,000 - $600,000 | €164,000 - €545,000 | $234,000/2 rooms | €213,000/2 rooms |
| Mini Golf (18 holes) | $100,000 - $600,000 | €91,000 - €545,000 | $511,000/course | €465,000/course |
| Trampoline Park | $1,000,000 - $3,000,000 | €910,000 - €2,730,000 | $2,180,000 average | €1,982,000 average |
| Billiards/Pool (4 tables) | $30,000 - $100,000 | €27,300 - €91,000 | $7,500/table | €6,800/table |
Profit margins and ROI
| Entertainment Type | Net Profit Margin | ROI Period | Revenue Per sq ft (USD) | Revenue Per sq m (EUR) |
|---|---|---|---|---|
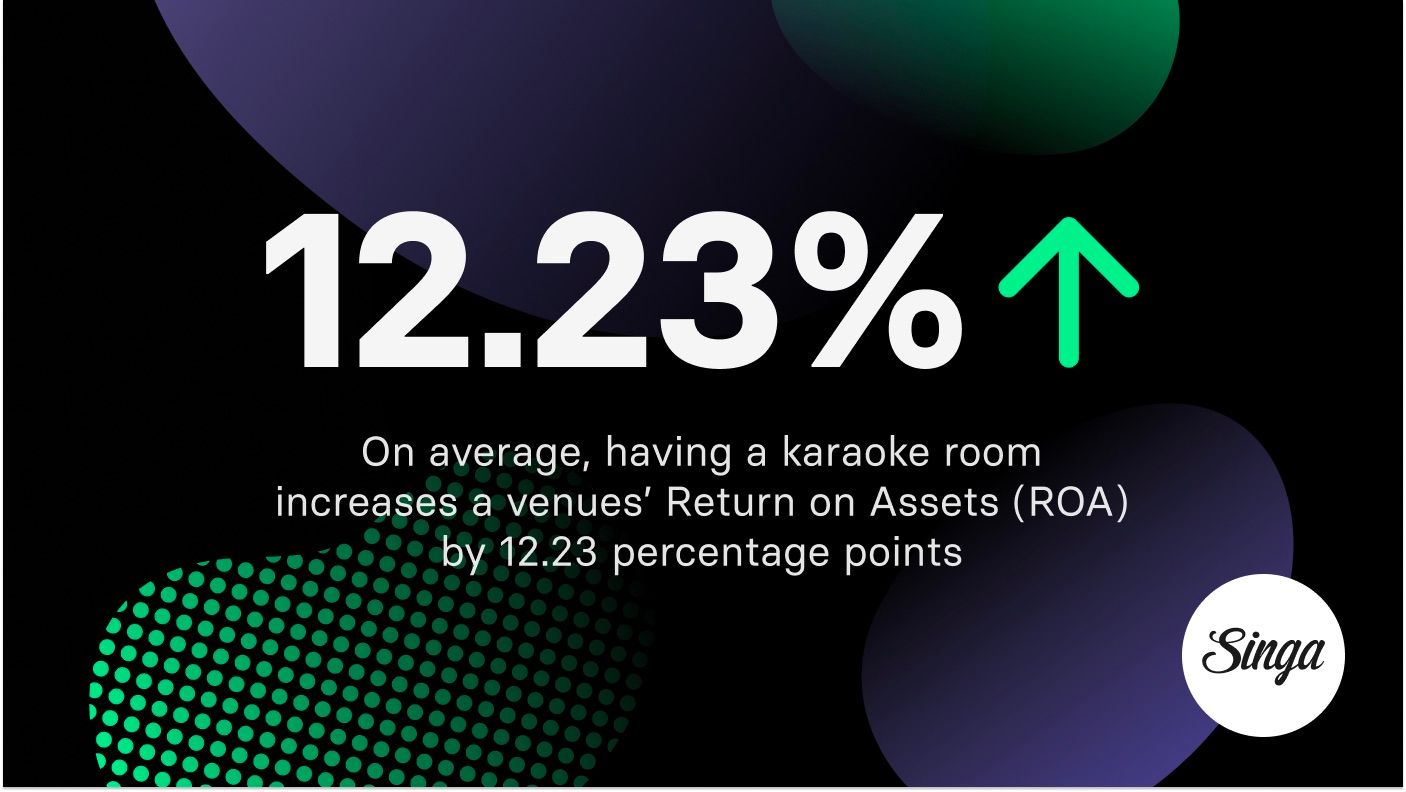
| Karaoke Rooms | 40-60% | 1-2 months | $350 - $400 | €325 - €372 |
| Self-Service Karaoke | 45-65% | 1-2 months | $300 - $350 | €279 - €325 |
| Bowling | 5-15% | 4-5 years | $30 - $50 | €28 - €46 |
| Arcade | 15-25% | 12-24 months | $100 - $300 | €93 - €279 |
| VR Games | 15-25% | 9-11 months | $200 - $350 | €186 - €325 |
| Axe Throwing | 15-35% | 18-24 months | $117 - $188 | €109 - €175 |
| Escape Rooms | 50%+ | 6-12 months | $90 - $300 | €84 - €279 |
| Mini Golf | 20-40% | 3-5 years | $20 - $30 | €19 - €28 |
| Trampoline Park | 20-40% | 3-4 years | $40 - $75 | €37 - €70 |
| Billiards/Pool | 30-50% | 6-18 months | $20 - $60 | €19 - €56 |
Entertainment concepts compared across key metrics
The following table presents a comprehensive comparison across all key metrics, based on industry averages, public pricing benchmarks, and operator case studies across Europe and North America.
| Entertainment Concept | Revenue per sq ft (USD) | Revenue per sq m (EUR) | Initial Investment (USD) | Initial Investment (EUR) | Monthly Revenue (USD) | Monthly Revenue (EUR) | Annual Revenue (USD) | Annual Revenue (EUR) | Net Annual Profit (USD) | Net Annual Profit (EUR) | Avg Spend per Guest (USD/EUR) | Dwell Time | Staffing | Maintenance | Scalability | Durability | Profit Margin | Operating Costs | ROI Period |
|---|---|---|---|---|---|---|---|---|---|---|---|---|---|---|---|---|---|---|---|
| Private Karaoke Room | $350 - $400 | €325 - €372 | $22,000 - $38,500 | €20,000 - €35,000 | $15,600 - $23,300 | €14,200 - €21,200 | $187,000 - $280,000 | €170,000 - €255,000 | $112,000 - $168,000 | €102,000 - €153,000 | $16 - $38 / €15 - €35 | 2-3 hours | Low-Medium | Very Low | Excellent | Very High | 40-60% | ~40% | 1-2 months |
| Self-Service Karaoke | $300 - $350 | €279 - €325 | $5,500 - $16,500 | €5,000 - €15,000 | $4,200 - $12,500 | €3,800 - €11,400 | $50,000 - $150,000 | €45,500 - €136,500 | $32,500 - $97,500 | €29,600 - €88,700 | $5 - $16 / €5 - €15 | 1-2 hours | Very Low | Very Low | Excellent | Very High | 45-65% | ~35% | 1-2 months |
| Escape Room | $90 - $300 | €84 - €279 | $14,000 - $100,000 | €13,000 - €91,000 | $15,000 - $50,000 | €13,700 - €45,500 | $180,000 - $600,000 | €164,000 - €545,000 | $90,000 - $300,000 | €82,000 - €272,500 | $22 - $38 / €20 - €35 | 60 min | High | Medium | Good | Low | 50%+ | ~50% | 6-12 months |
| VR Gaming Arena | $200 - $350 | €186 - €325 | $50,000 - $120,000 | €45,500 - €109,000 | $5,200 - $55,000 | €4,700 - €50,000 | $62,400 - $660,000 | €56,700 - €600,000 | $15,600 - $165,000 | €14,200 - €150,000 | $16 - $44 / €15 - €40 | 30-45 min | High | High | Medium | Medium | 15-25% | ~75-85% | 9-11 months |
| Axe Throwing | $117 - $188 | €109 - €175 | $50,000 - $250,000 | €45,500 - €228,000 | $20,800 - $62,500 | €19,000 - €56,800 | $250,000 - $750,000 | €228,000 - €682,000 | $62,500 - $262,500 | €57,000 - €238,700 | $22 - $38 / €20 - €35 | 1-2 hours | High | Low | Medium | Medium | 15-35% | ~65-85% | 18-24 months |
| Bowling Lane | $30 - $50 | €28 - €46 | $18,000 - $45,000 | €16,500 - €41,000 | $3,000 - $3,750 | €2,800 - €3,400 | $36,750 - $45,000 | €33,400 - €41,000 | $3,700 - $6,800 | €3,300 - €6,200 | $5 - $11 / €5 - €10 | 1-2 hours | Medium | High | Poor | High | 5-15% | ~75-85% | 4-5 years |
| Mini Golf | $20 - $30 | €19 - €28 | $300,000 - $800,000 | €273,000 - €728,000 | $8,300 - $50,000 | €7,600 - €45,500 | $100,000 - $600,000 | €91,000 - €545,000 | $30,000 - $240,000 | €27,300 - €218,000 | $11 - $22 / €10 - €20 | 45-60 min | Medium | Medium | Poor | Medium | 20-40% | ~60-80% | 3-5 years |
| Arcade Machines | $100 - $300 | €93 - €279 | $50,000 - $150,000 | €45,500 - €137,000 | $30,000 - $50,000 | €27,300 - €45,500 | $360,000 - $600,000 | €327,000 - €545,000 | $90,000 - $150,000 | €81,800 - €136,300 | $1 - $3 / €1 - €3 | Variable | Low | Medium | Good | Medium | 15-25% | ~75-85% | 12-24 months |
| Billiards/Pool | $20 - $60 | €19 - €56 | $1,000 - $5,000 | €900 - €4,500 | $625 - $2,080 | €570 - €1,900 | $7,500 - $25,000 | €6,800 - €22,700 | $3,750 - $12,500 | €3,400 - €11,400 | $9 - $22 / €8 - €20 | 1-2 hours | Low | Low | Good | High | 30-50% | ~50-70% | 6-18 months |
| Trampoline Park | $40 - $75 | €37 - €70 | $500,000 - $3,000,000 | €455,000 - €2,730,000 | $83,300 - $250,000 | €75,800 - €227,500 | $1,000,000 - $3,000,000 | €910,000 - €2,730,000 | $300,000 - $1,200,000 | €273,000 - €1,092,000 | $16 - $27 / €15 - €25 | 1-2 hours | High | Very High | Poor | Medium | 20-40% | ~60-80% | 3-4 years |
These figures represent gross activity revenue. The real differentiation comes from how these activities influence total venue spend, particularly food and beverage attachment.
The financial case for karaoke rooms
Private karaoke rooms consistently demonstrate exceptional financial performance across multiple metrics. According to a study of 37 London venues, karaoke nights increased customer numbers by 31% and customer spending by 42%.
Here's why karaoke rooms excel:
- Space efficiency: Even compact karaoke rooms, starting from just 65 square feet (6 m²), can generate significantly higher revenue density than larger-format attractions. On average, well-utilized karaoke rooms can produce $30-$35 per square foot annually (€325-€372 per square meter). By comparison, bowling typically generates $3-$4 per square foot (€28-€46 per square meter), while mini golf averages $2-$3 per square foot (€19-€28 per square meter) annually.
- Low operating costs: Unlike bowling alleys requiring constant pinsetter maintenance or trampoline parks with significant insurance expenses (up to 15% of revenue), karaoke rooms have minimal ongoing costs.
- Quick payback period: The karaoke room systems market shows commercial venues typically achieve ROI within 1-2 months. Meanwhile, bowling alleys average 4-5 years and trampoline parks 3-4 years.
- Diversified demand: Karaoke attracts corporate groups, birthday parties, date nights, and casual gatherings. The 2025 Experiential Leisure Report notes that 30% of UK adults have visited competitive socialising venues, with 35% visiting weekly.
Karaoke rooms monetize time more efficiently
A private karaoke room typically hosts 4-12 guests. If a group pays $128 (€120) for a two-hour session and orders $214-$428 (€200-€400) in food and drinks, the total ticket size can reach $342–$556 (€320-€520) per room.
That translates to:
- $171-$278 (€160-€260) per hour per room including F&B
- High predictability of bookings
- Strong weekend peak optimization
Because karaoke is social and participatory, guests remain seated, ordering drinks throughout the session.
By comparison:
- Escape rooms usually last 60 minutes and guests often leave afterward.
- Axe throwing and VR sessions are typically short and rotation-based.
- Arcade play is fragmented and does not anchor guests in one place.
Self-service karaoke reduces staffing overhead
Traditional entertainment formats often require supervision:
- Axe throwing lanes require trained staff for safety.
- Escape rooms require game masters.
- VR arenas need attendants for equipment support.
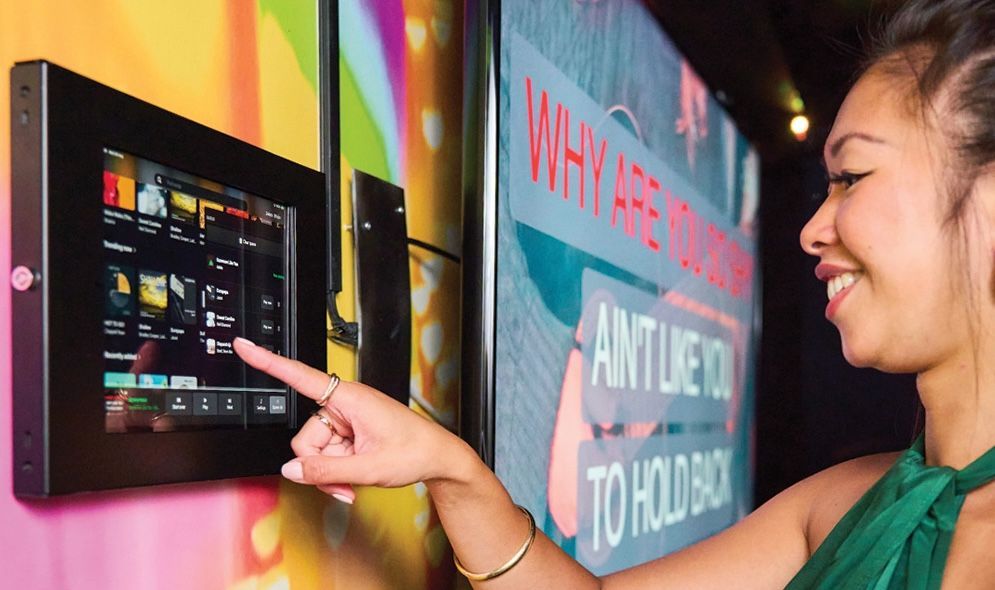
Self-service karaoke systems significantly reduce this burden. With intuitive touch interfaces and automated song queuing, staff involvement is minimal once guests are onboarded.
Reduced staffing needs improve margins, especially in markets where wages are rising. Entertainment concepts that grow without requiring more labor become financially stronger.
How other entertainment options compare
Bowling: High investment, modest returns
Bowling alleys face significant challenges. According to IBISWorld data, the US bowling industry generated $4.8 billion in 2024 with projected 3.5% annual growth. However, individual venues struggle with:
- High per-lane costs ($18,000-$45,000 / €16,500-€41,000)
- Large space requirements (100-150 sq ft / 9-14 sq m per lane)
- Extensive maintenance needs
- Lower profit margins (5-15%)
A 12-lane bowling center generating $1.5 million annually earns just $36,750 (€33,400) per lane — significantly less than karaoke rooms at $94,000 (€85,500) per room.
Arcade games: Volume-dependent profitability
Arcades can be profitable but require significant machine counts. Industry analysis shows:
- Mid-sized arcades (30 machines) generate $360,000-$600,000 (€327,000-€545,000) annually
- Individual machines earn $200-$485 (€182-€441) per week
- Revenue per square foot: $100-$300 (€93-€279 per square meter)
- Profit margins: 15-25%
The US arcade market grew at 8.2% CAGR to reach $3.2 billion in 2023, but success demands constant equipment updates and high foot traffic.
VR arcades: Premium pricing, high equipment costs
VR represents a high-tech alternative with strong growth projections. The location-based VR market should reach $38.61 billion by 2032, growing at 35% CAGR.
However, VR faces challenges:
- High initial equipment costs ($30,000-$80,000 / €27,000-€73,000)
- Frequent hardware upgrades needed
- Motion sickness concerns
- Smaller customer base
VionVR data shows small VR arcades can achieve $5,200-$55,000 (€4,700-€50,000) monthly revenue with 9-11 month payback periods — competitive but requiring constant tech investment.
Axe throwing: Trendy but space-intensive
Axe throwing exploded in popularity, with US venues generating $300 million in 2024. The typical financial profile:
- 6-lane setup: $50,000-$250,000 (€45,500-€228,000) investment
- Annual revenue: $250,000-$750,000 (€228,000-€682,000)
- Profit margins: 15-35%
- Space requirement: 2,000-4,000 sq ft (186-372 sq m)
Operator data suggests a 6-lane facility generates approximately $47,300 (€43,000) monthly, but the trend-dependent nature raises sustainability concerns.
Escape rooms: Strong margins, limited replay value
Escape rooms excel at profitability but face inherent limitations. Market analysis values the global escape room market at $12.71 billion in 2024, projected to reach $38.33 billion by 2032.
Key metrics:
- Startup costs: $7,000-$50,000 (€6,400-€45,500) per room
- Monthly revenue: $15,000-$50,000 (€13,600-€45,500) for 2 rooms
- Profit margins: 50%+
- ROI period: 6-12 months
The main challenge: customers typically play each room once, requiring constant new room development to maintain repeat business.
Mini golf: Seasonal constraints and high costs
Mini golf demands substantial investment with mixed returns. Financial projections show:
- 18-hole indoor course: $300,000-$800,000 (€273,000-€728,000)
- Annual revenue: $100,000-$600,000 (€91,000-€545,000)
- Profit margins: 20-40%
- Space requirement: 5,000-20,000 sq ft (465-1,858 sq m)
Revenue analysis indicates well-trafficked courses generate $511,000 (€465,000) annually, but outdoor venues face seasonal fluctuations while indoor facilities require massive upfront investment.
Trampoline parks: Highest revenue, highest risk
Trampoline parks lead in total revenue but require enormous investment. Industry data reveals:
- Initial investment: $500,000-$3,000,000 (€455,000-€2,730,000)
- Average annual revenue: $1,000,000-$3,000,000 (€910,000-€2,730,000)
- Profit margins: 20-40%
- Space requirement: 25,000-40,000 sq ft (2,323-3,716 sq m)
Franchise data shows top performers like Altitude Trampoline Park averaging $2.18 million (€1,982,000) in annual sales, but venues face significant liability insurance costs (15% of revenue) and maintenance expenses.
Realistic revenue uplift examples
Let’s look at three simplified scenarios to illustrate uplift potential.
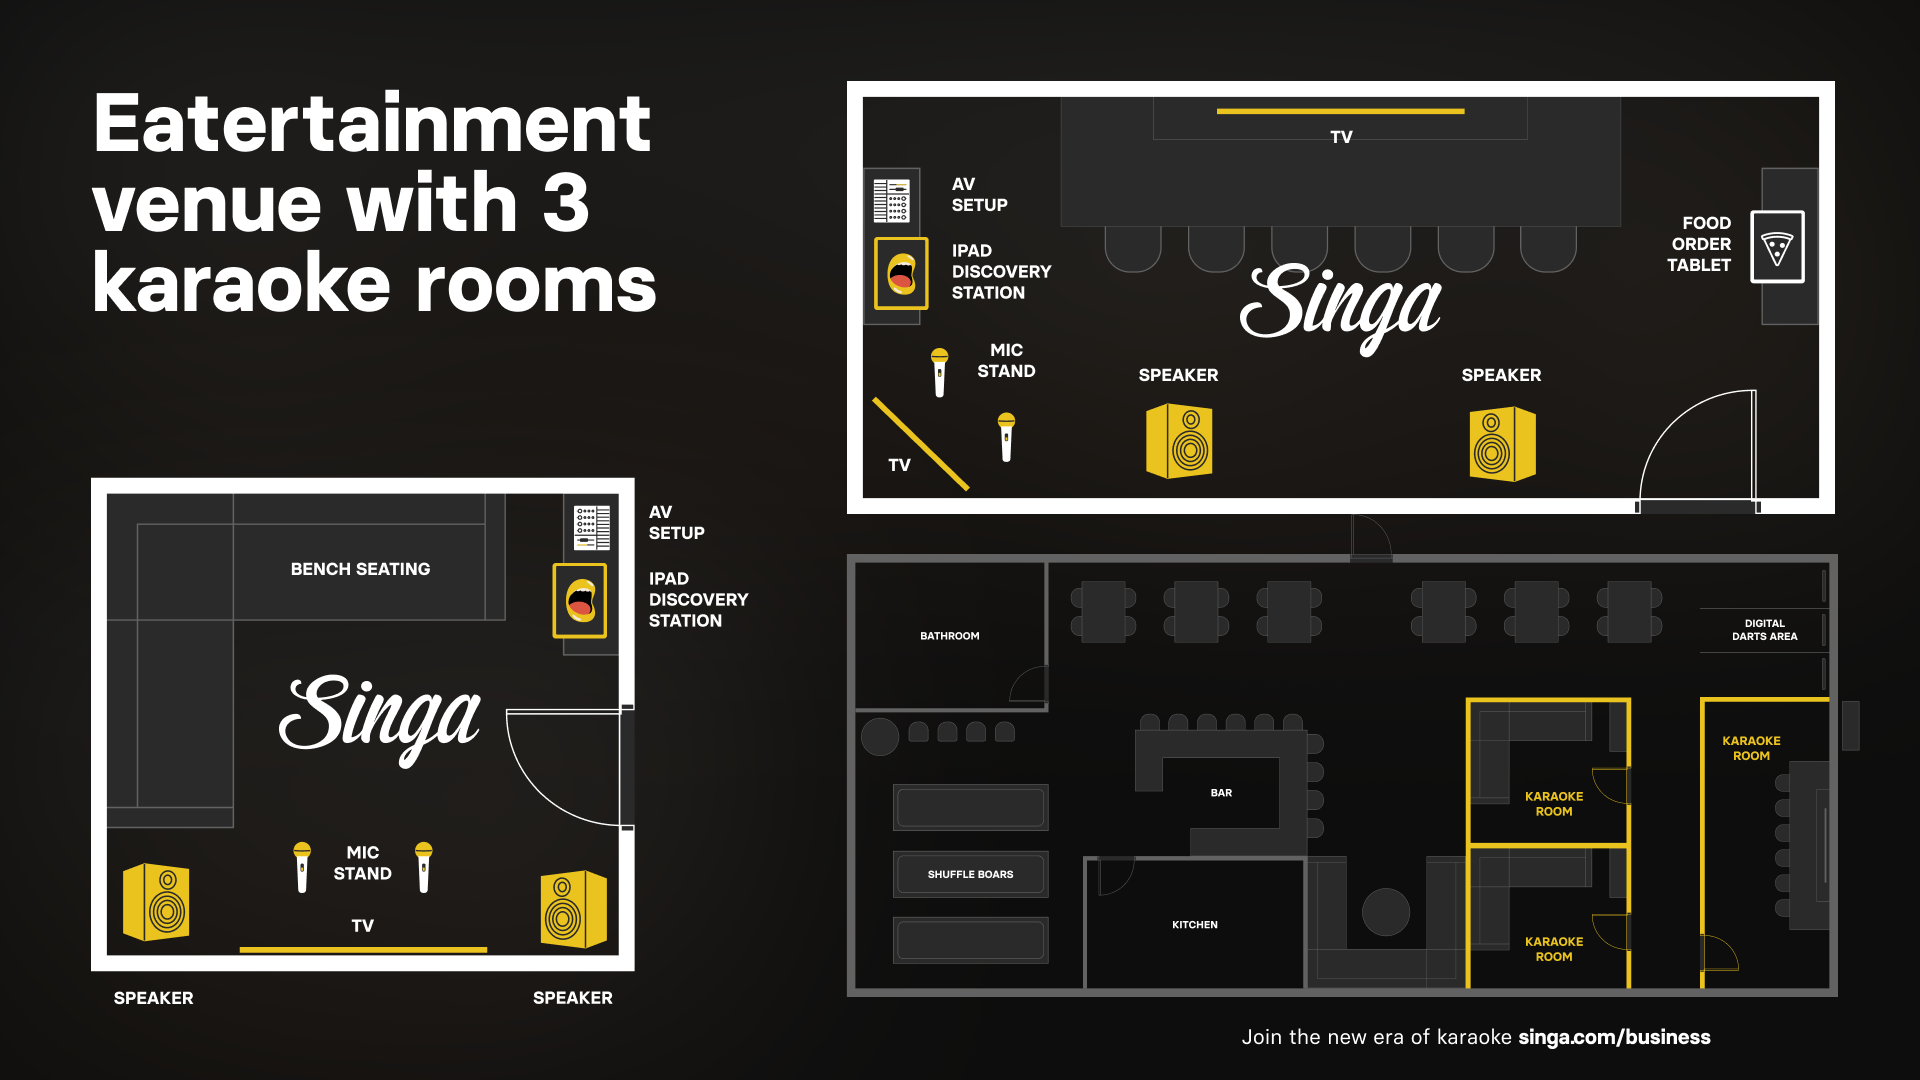
Scenario 1: Adding two karaoke rooms to an existing bar
- Space converted: 538 sq ft (50 sq m)
- 2 rooms, 8 guests each
- Average booking: $150 (€140) per 2-hour session
- 5 sessions per day per room on weekends, 2 on weekdays
Estimated monthly activity revenue: $21,500-$32,000 (€20,000-€30,000)
Estimated additional F&B revenue: $16,000-$27,000 (€15,000-€25,000)
Total potential uplift: $37,500-$59,000 (€35,000-€55,000) per month

Scenario 2: Self-service karaoke zone in a 3,230 sq ft (300 sq m) venue
- 1 central stage or designated karaoke zone
- Digital self-service system with on-screen song selection
- Pricing via song credits, timed access, or minimum spend packages
- 200-300 additional participants per week
Estimated monthly revenue uplift: $9,100-$17,000 (€8,000-€15,000)
Increased dwell time impact on food and beverage consumption: 10-25% uplift
Self-service karaoke performs best in:
- Student bars
- Nightclubs
- Late-night cocktail bars
- Resort bars
- Large casual entertainment venues
- Music-focused venues
This model works because it keeps guests engaged without requiring a large structural investment or dedicated room staffing, and scales naturally with foot traffic. The result is incremental revenue layered onto the venue’s existing operation.
Scenario 3: Replacing underperforming billiards tables
Two billiards tables generate $3,200 (€3,000) per month, using 258 sq ft (24 sq m) of space.
Replacing those two tables with one 215-269 sq ft (20-25 sq m) private karaoke room can generate:
- $6,000-$12,000 (€5,500-€11,000) per month depending on pricing and utilization
Resulting uplift:
- 2x-4x total monthly revenue
- 150%-300% increase in revenue per square meter
- Higher booking predictability through advance reservations
- Stronger private event and group booking conversion
Unlike billiards, which relies on casual, low-ticket usage and often sits idle during off-peak hours, a private karaoke room supports:
- Pre-booked sessions
- Minimum spend policies
- Package pricing
- Birthday and corporate events
The shift not only increases revenue density but also converts loosely monetized floor space into a structured, bookable asset with more consistent cash flow.
Making the right entertainment choice for your venue
When evaluating entertainment options, consider these key factors:
Available space
Karaoke rooms, VR arcades, and escape rooms excel in compact spaces (under 1,000 sq ft / 93 sq m). Bowling, mini golf, and trampoline parks require significantly more square footage.
Capital availability
With under $50,000 (€45,500), consider karaoke rooms, escape rooms, or small arcade setups. For $100,000-$500,000 (€91,000-€455,000), VR arcades and axe throwing become viable. Over $500,000 (€455,000) enables bowling, mini golf, or trampoline parks.
Target demographic
Karaoke attracts the broadest age range and group sizes. Trampoline parks skew younger (families with kids under 12), while axe throwing targets adults 21-35.
Operating complexity
Karaoke rooms require minimal staff and maintenance. Bowling, trampoline parks, and VR arcades demand specialized maintenance and higher insurance.
Scalability
Starting small? Karaoke rooms and escape rooms allow phased expansion. Add new rooms as demand grows without massive additional investment.
Karaoke rooms present a compelling value proposition: low investment, high returns, minimal complexity, and broad appeal across demographics. The numbers consistently show karaoke outperforming traditional entertainment options in the metrics that matter most to venue profitability.
Try the calculator: find your optimal entertainment mix
The numbers tell a compelling story, but every venue has unique constraints and opportunities. Singa's new Venue Entertainment Choice calculator helps you model different entertainment options based on your specific:
- Available square footage
- Budget constraints
- Atmosphere choice
- Investment goals
The calculator uses real industry data to project revenue, costs, and ROI for various entertainment combinations. Discover which entertainment approach delivers the best results for your venue.

The bottom line on entertainment ROI
Entertainment venue success requires matching the right attractions to your space, budget, and market. The data reveals clear patterns:
- For space efficiency: Karaoke rooms ($350+/sq ft) and VR arcades ($200+/sq ft) dramatically outperform bowling ($30+/sq ft) and mini golf ($20+/sq ft).
- For quick ROI: Karaoke rooms (1-2 months) and escape rooms (6-12 months) recover investment far faster than bowling alleys (4-5 years) or trampoline parks (3-4 years).
- For profit margins: Karaoke rooms (40-60%) and escape rooms (50%+) deliver superior margins compared to bowling (5-15%) or VR arcades (15-25%).
- For operational simplicity: Karaoke rooms require minimal maintenance and staffing while bowling alleys, trampoline parks, and VR arcades demand specialized technical support.
The entertainment option generating the highest revenue per square foot requires no specialized maintenance, no liability waivers, and no full-time technicians. It recovers its investment in weeks rather than years. And it costs less to install than a single bowling lane. Karaoke rooms consistently outperform traditional entertainment attractions in profitability metrics.
Use the entertainment calculator to model how karaoke rooms could transform your venue's revenue potential. The data speaks for itself — now it's time to put those numbers to work.